Streaming analytics on Google Cloud
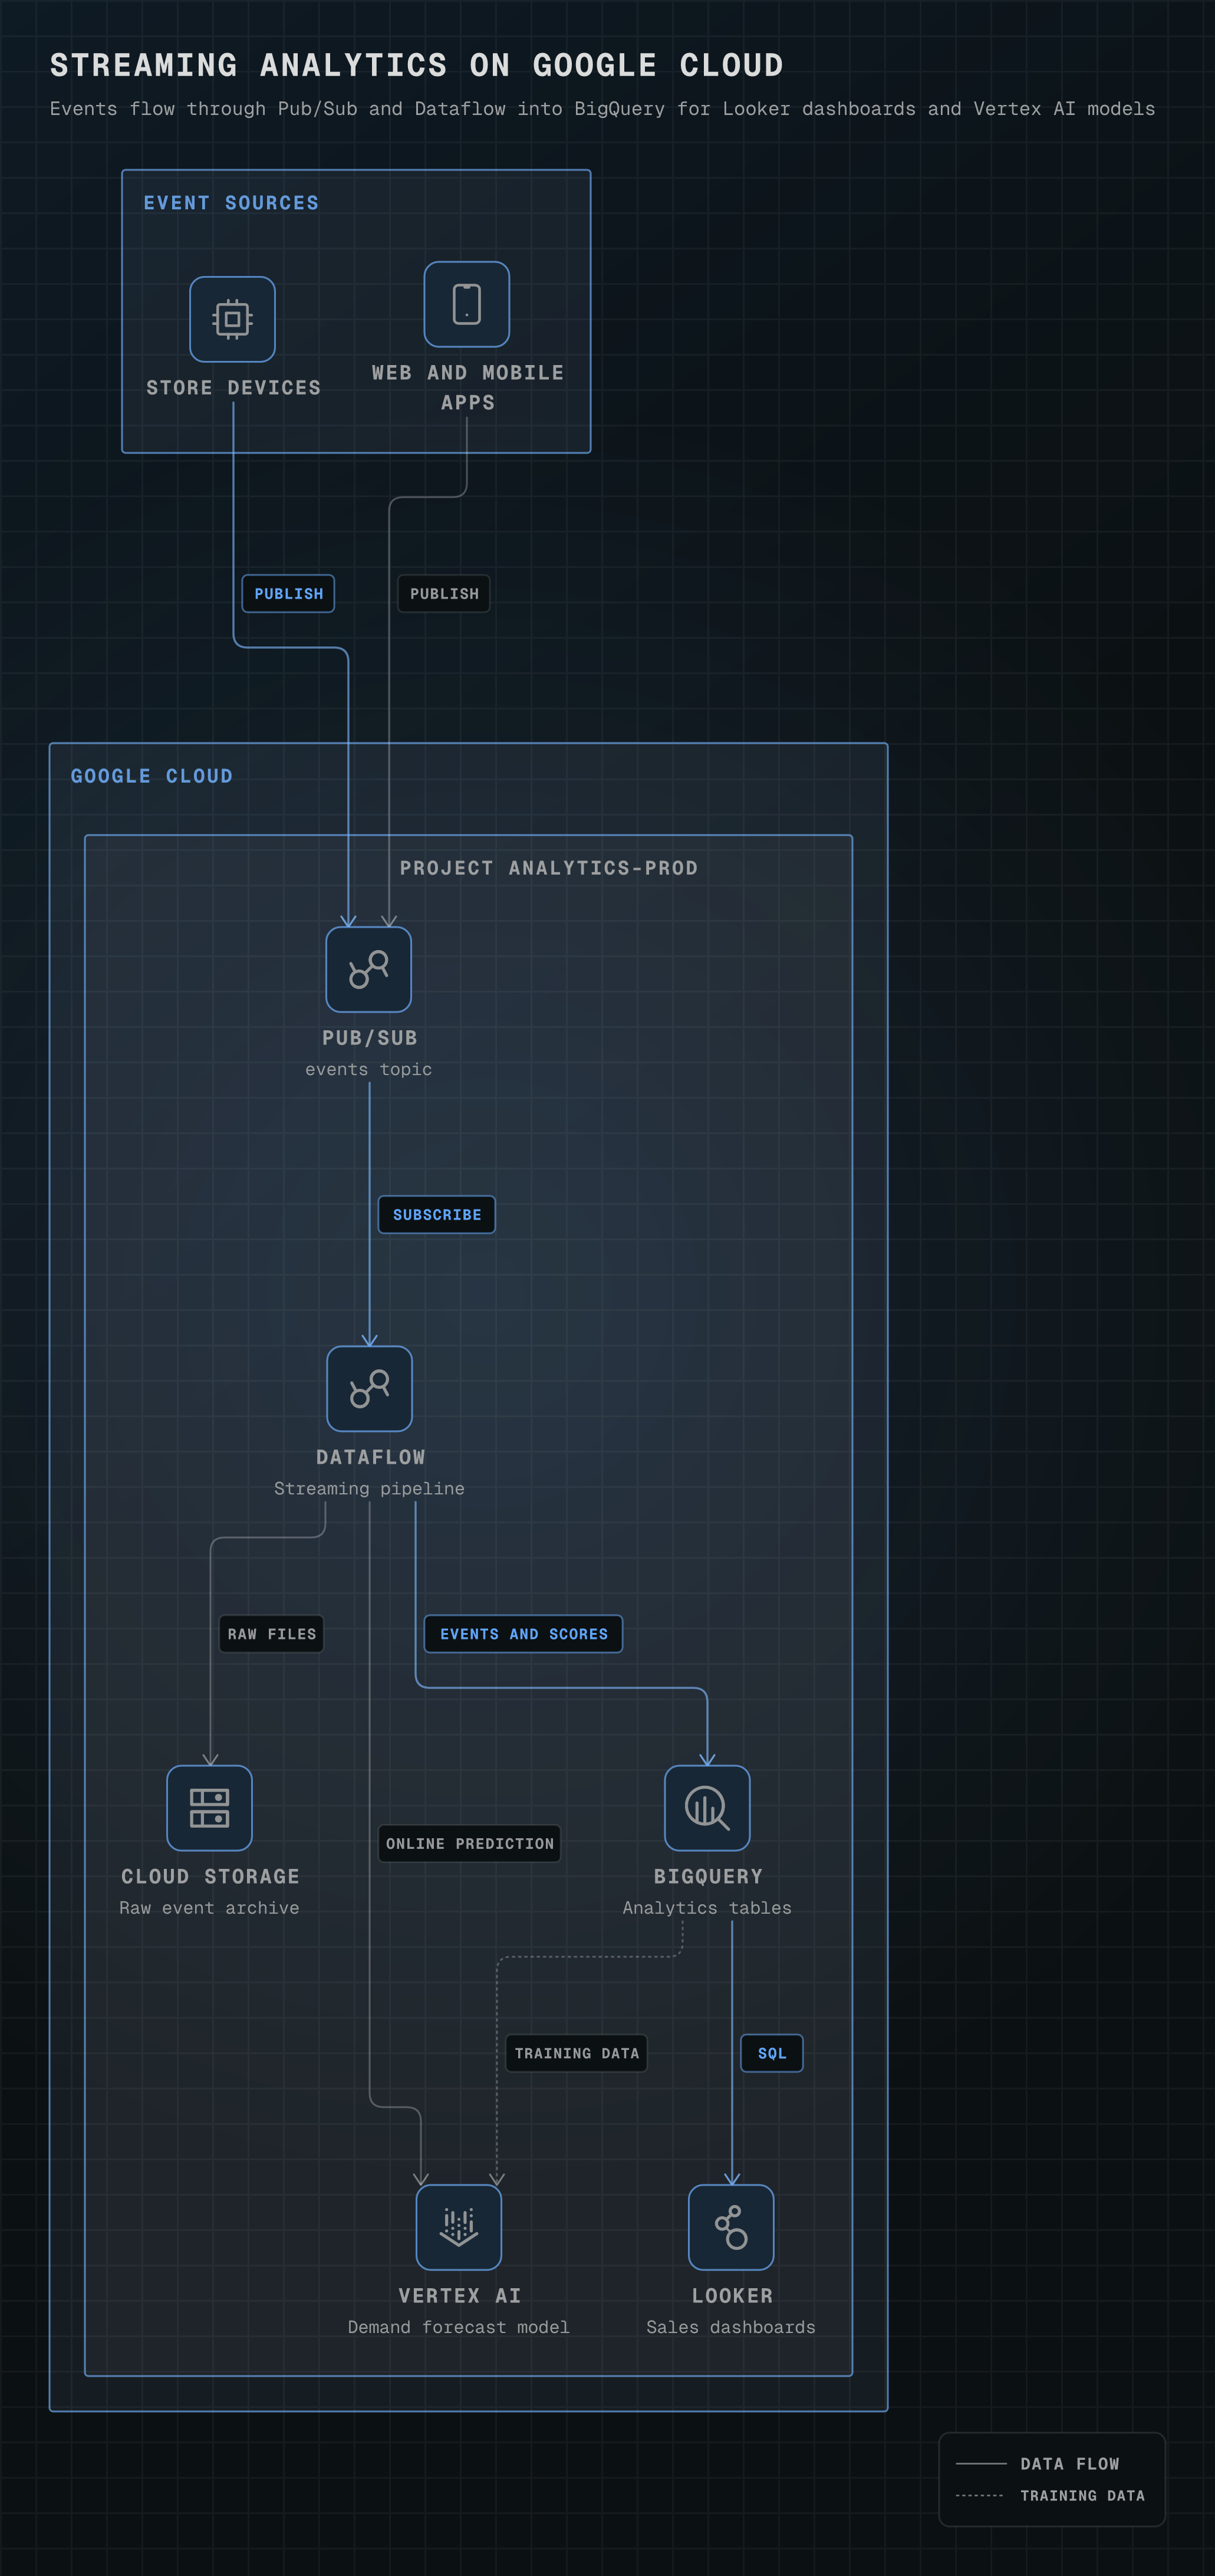
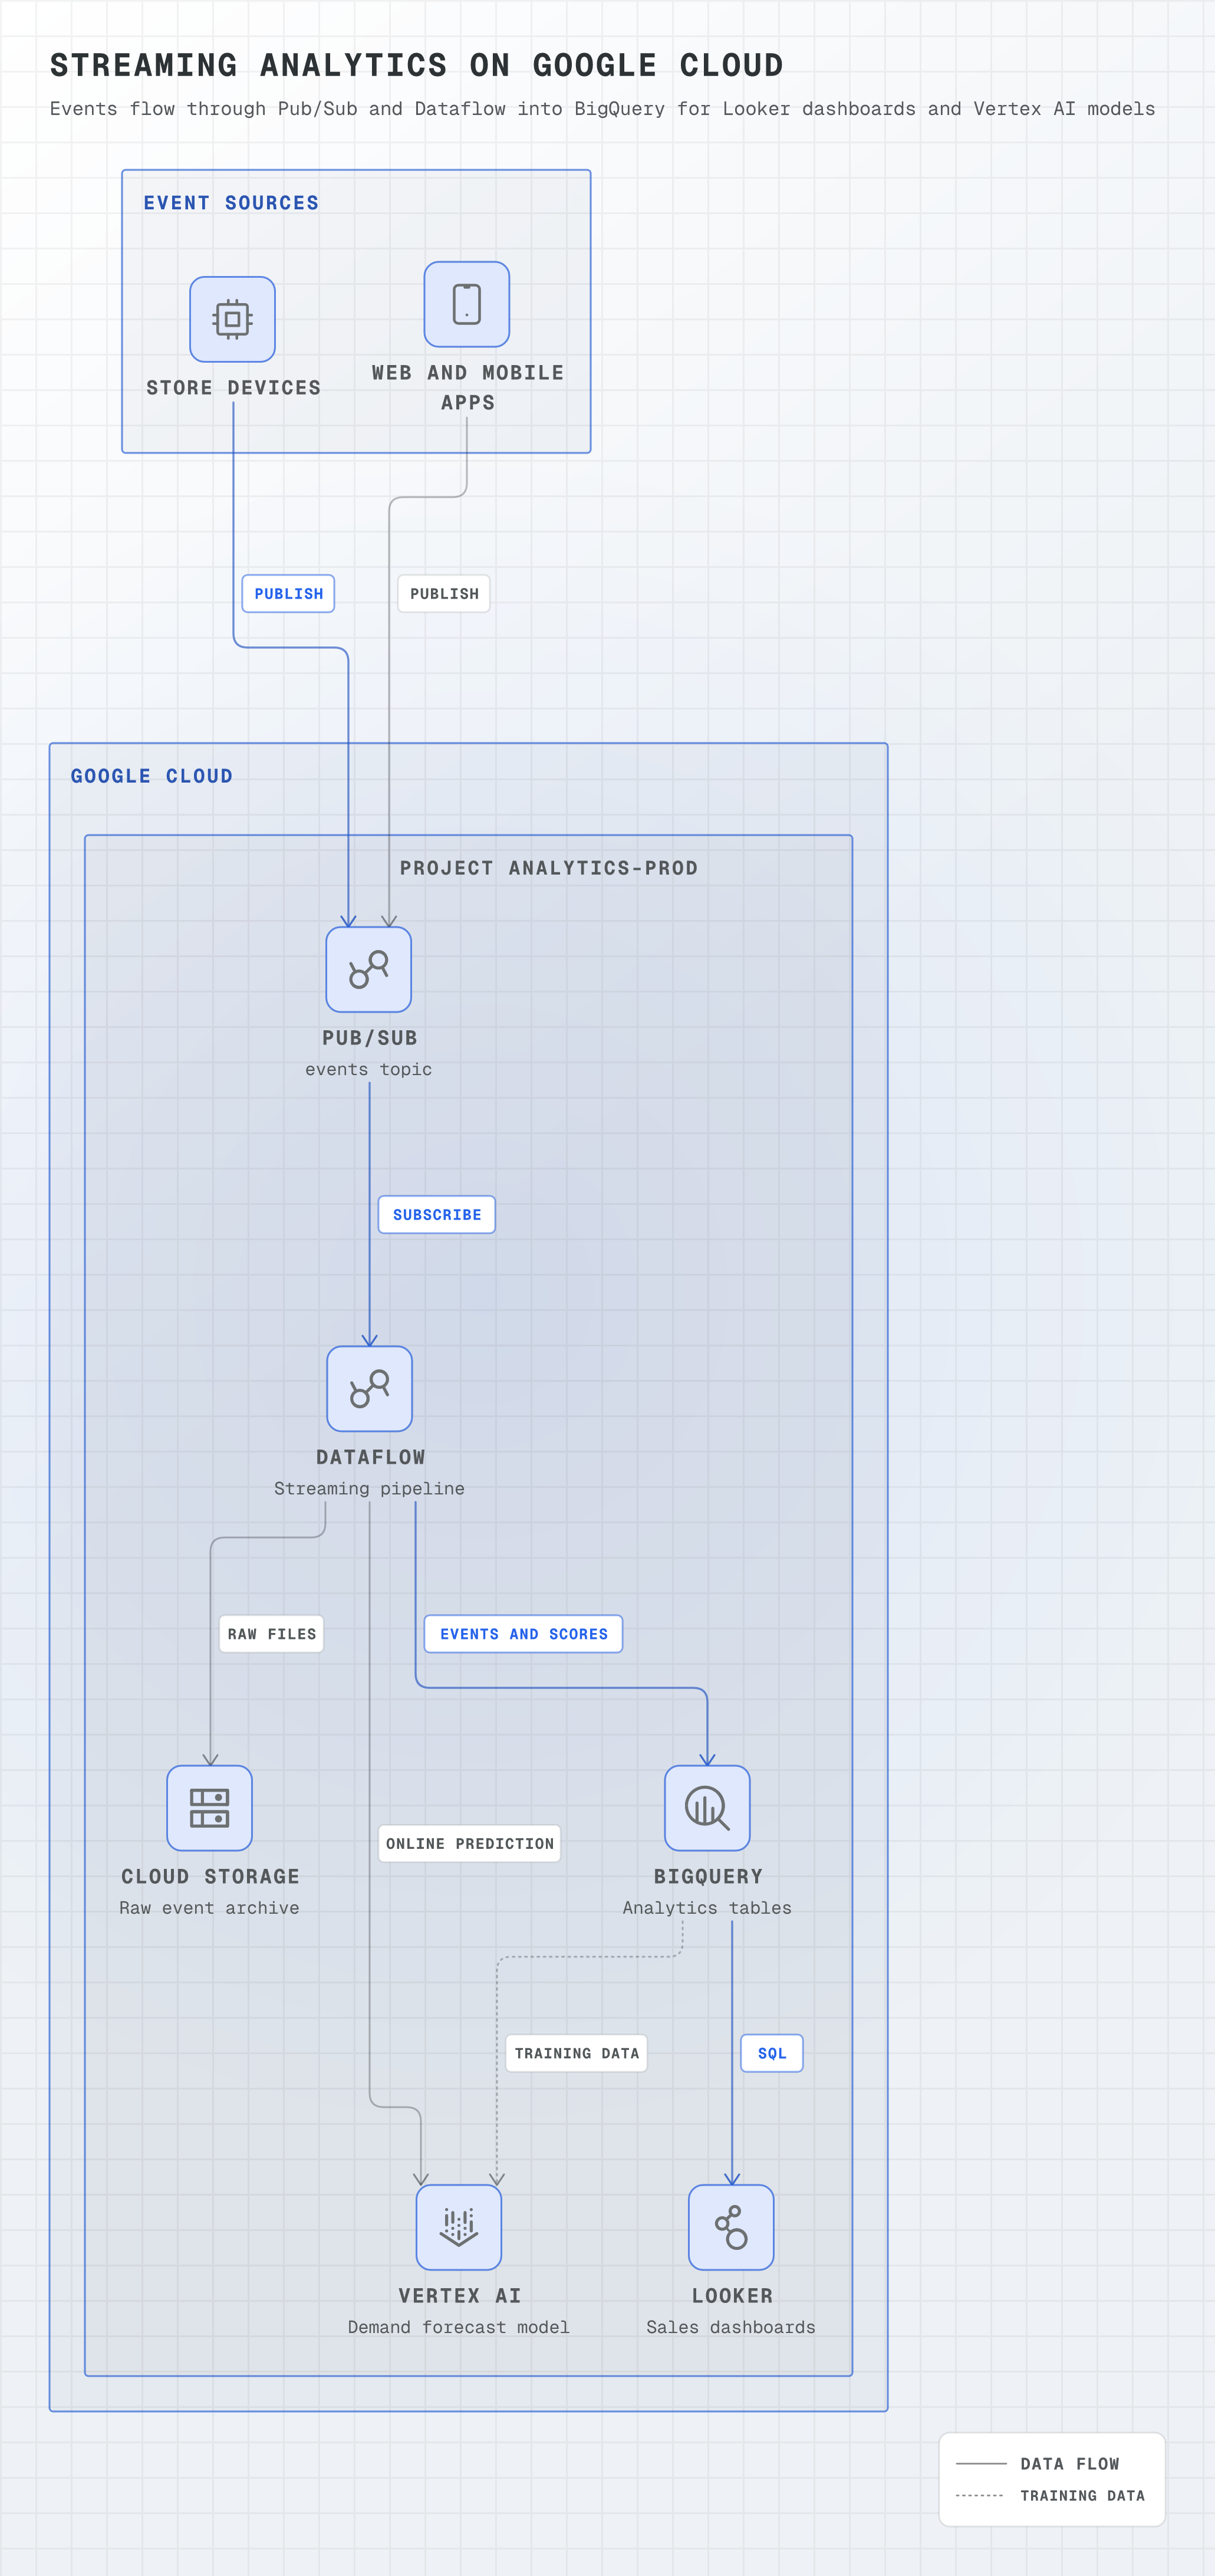
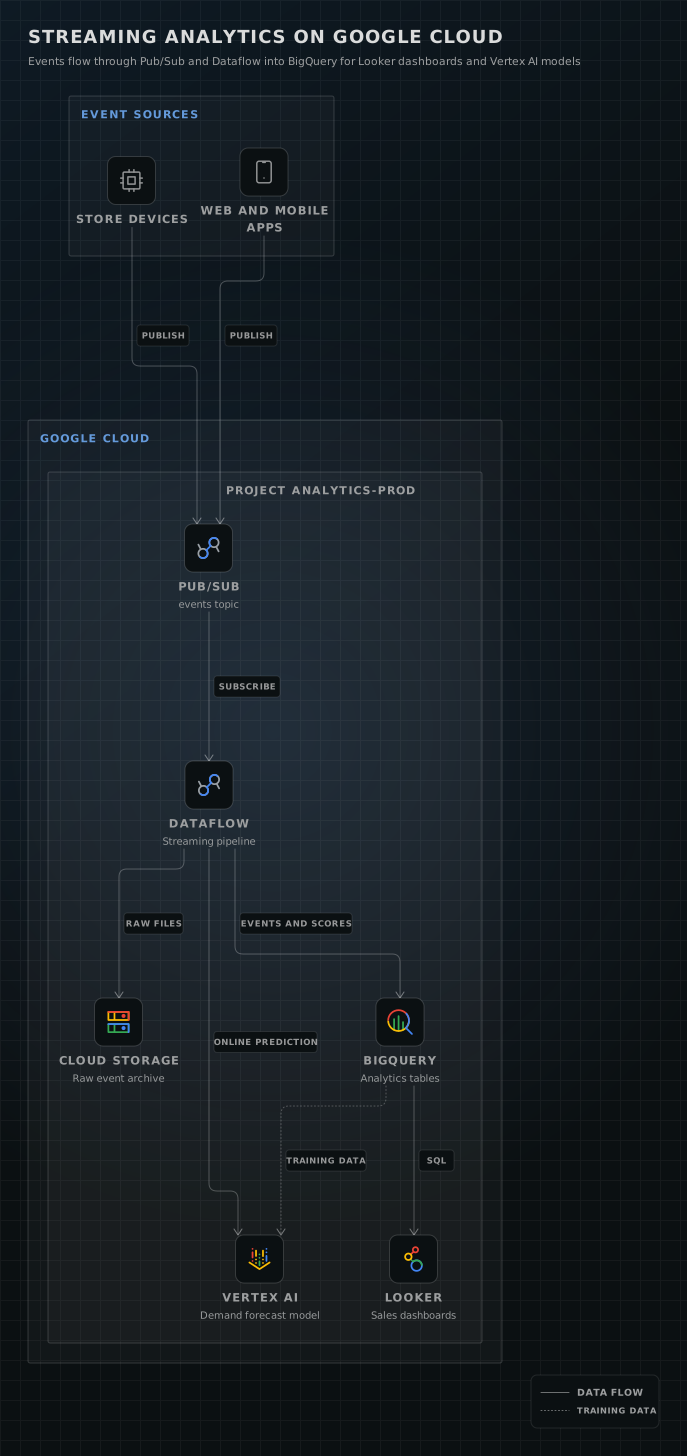
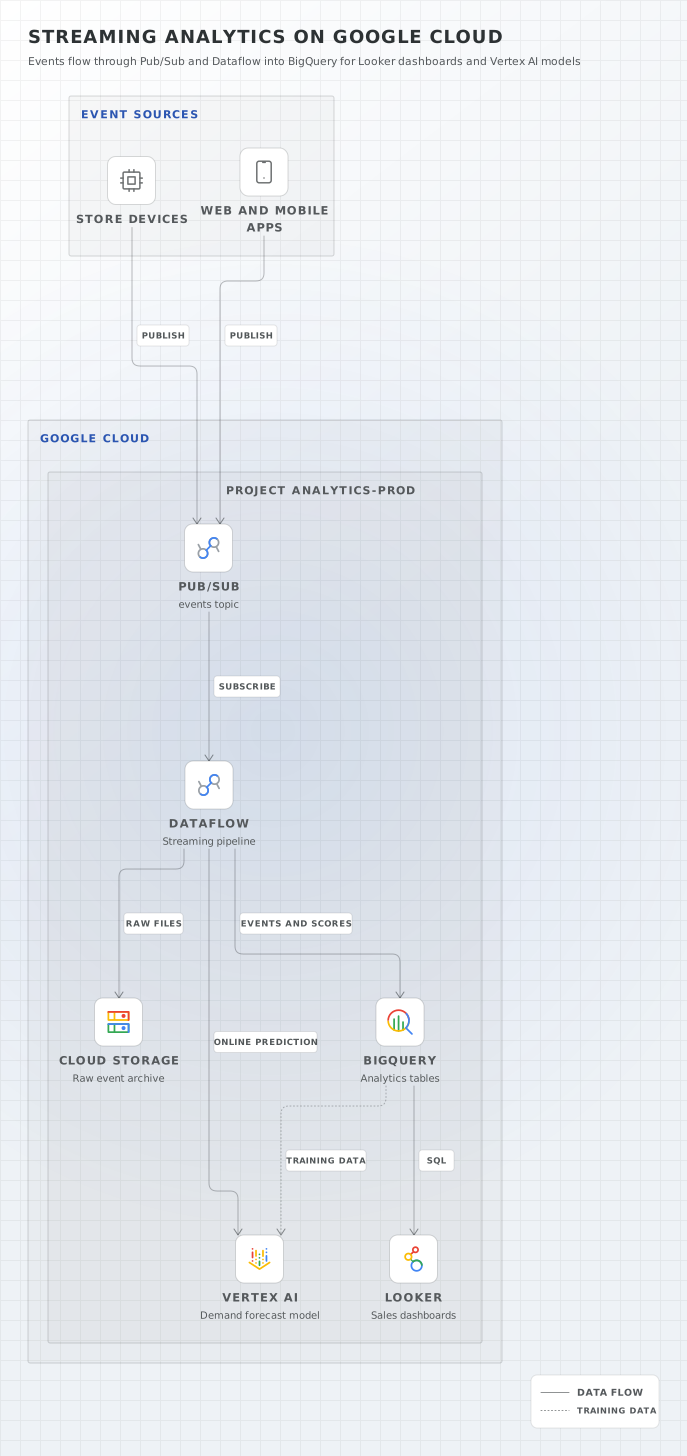
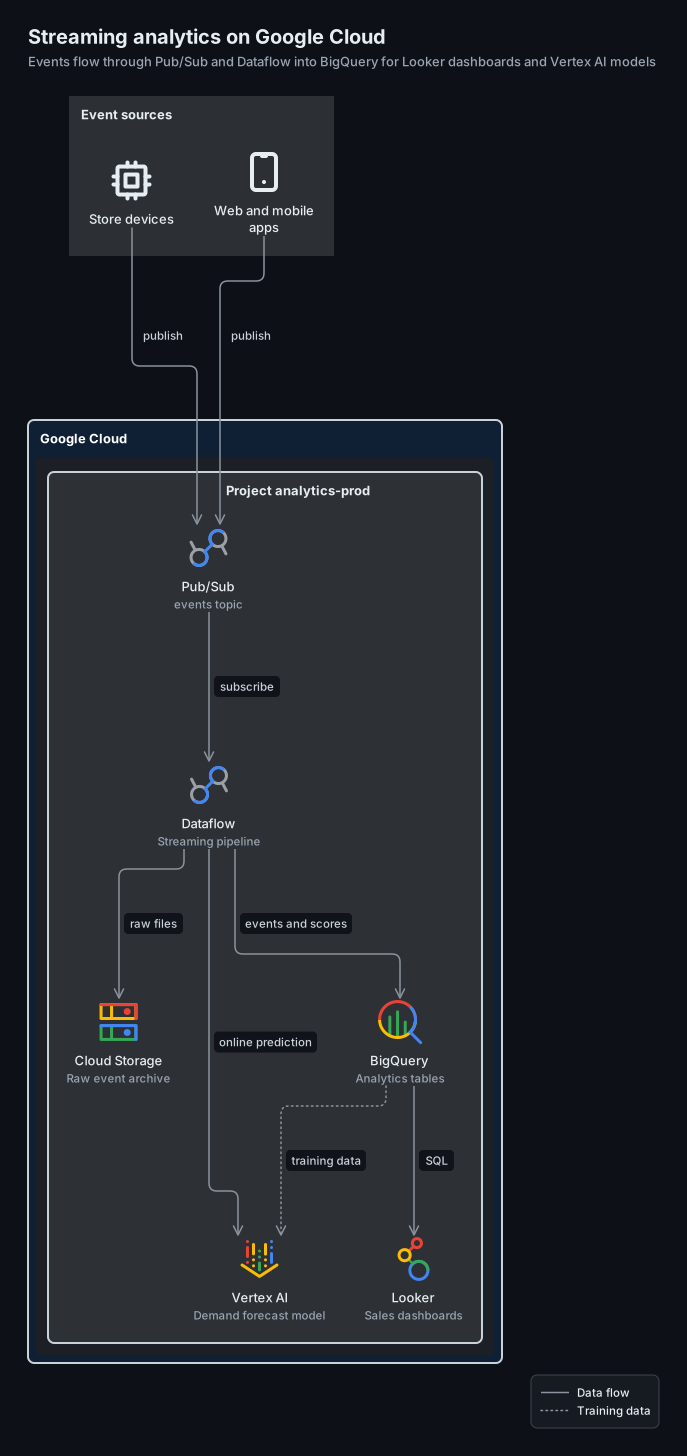
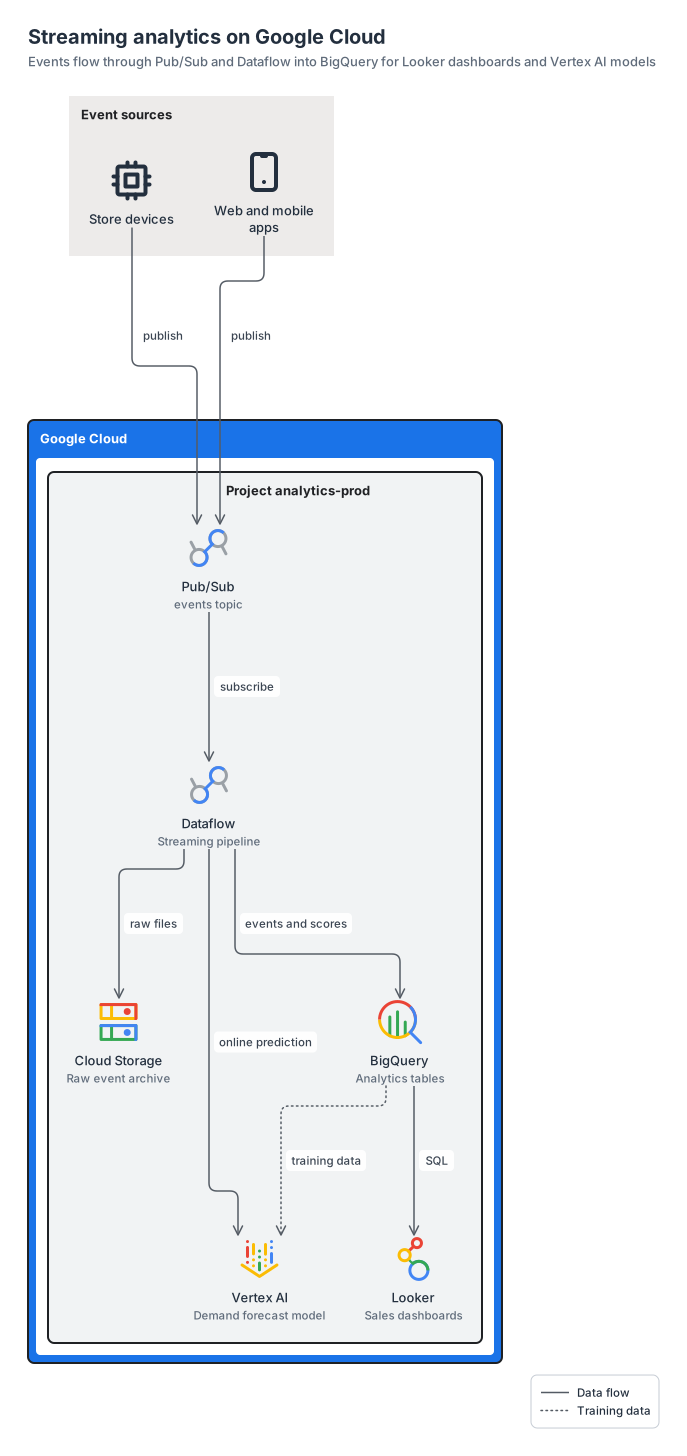
Pub/Sub and Dataflow stream events into BigQuery and Cloud Storage and score them with a Vertex AI model, with Looker dashboards on BigQuery.
gcp8 nodes3 groups7 edges
gcp-streaming-analytics.yamlOn GitHub
# yaml-language-server: $schema=../references/diagram.schema.json
title: Streaming analytics on Google Cloud
subtitle: Events flow through Pub/Sub and Dataflow into BigQuery for Looker dashboards and Vertex AI models
direction: down
# One port per edge: the two publish edges and Dataflow's three outputs each keep their own arrowhead.
layout: { merge: false }

legend:
  solid: Data flow
  dotted: Training data

groups:
  sources: { type: gcp:external, label: Event sources }
  gcloud: { type: gcp:cloud }
  project: { type: gcp:project, label: Project analytics-prod, in: gcloud }

nodes:
  devices: { icon: generic:iot, label: Store devices, in: sources }
  apps: { icon: generic:mobile, label: Web and mobile apps, in: sources }
  topic: { icon: gcp:pubsub, label: Pub/Sub, note: events topic, in: project }
  pipeline: { icon: gcp:dataflow, label: Dataflow, note: Streaming pipeline, in: project }
  archive: { icon: gcp:cloud-storage, label: Cloud Storage, note: Raw event archive, in: project }
  warehouse: { icon: gcp:bigquery, label: BigQuery, note: Analytics tables, in: project }
  model: { icon: gcp:vertex-ai, label: Vertex AI, note: Demand forecast model, in: project }
  dashboards: { icon: gcp:looker, label: Looker, note: Sales dashboards, in: project }

edges:
  - devices, apps -> topic: publish
  - topic -> pipeline: subscribe
  - pipeline -> warehouse: events and scores
  - pipeline -> archive: raw files
  - pipeline -> model: online prediction
  - warehouse -> dashboards: SQL
  - warehouse ..> model: training data
Start from this one
Copies the spec to diagram.yaml, then renders every format.
$ orrery init gcp-streaming-analytics$ orrery render diagram.yaml -f all --theme both