Observability stack with OpenTelemetry
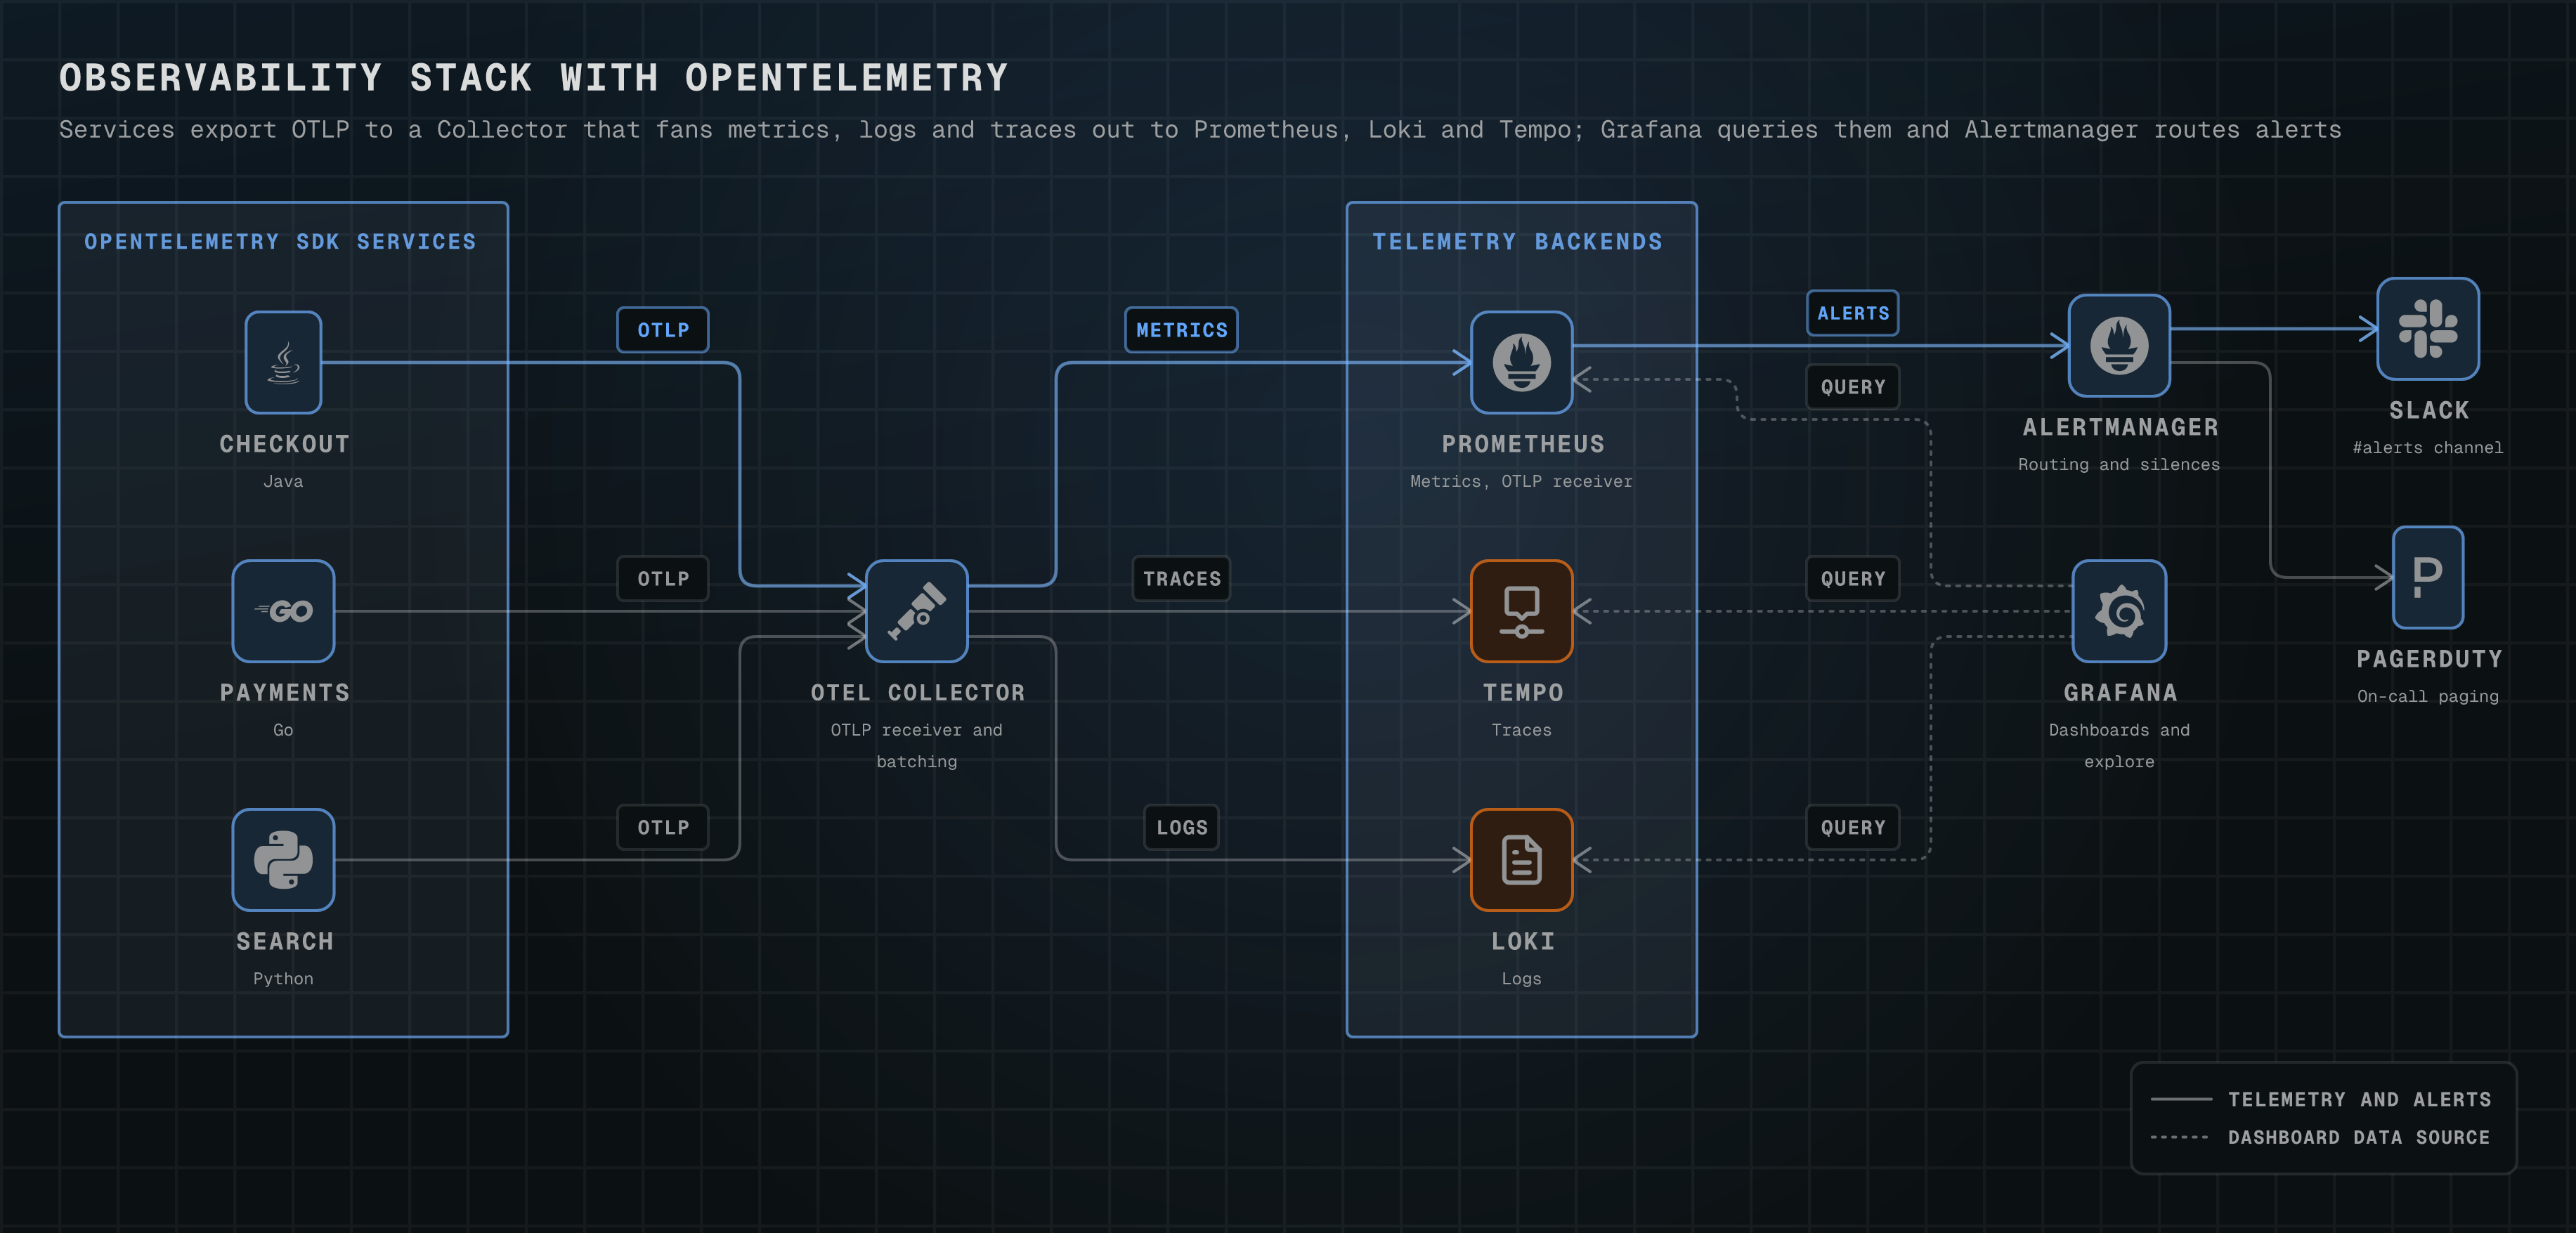
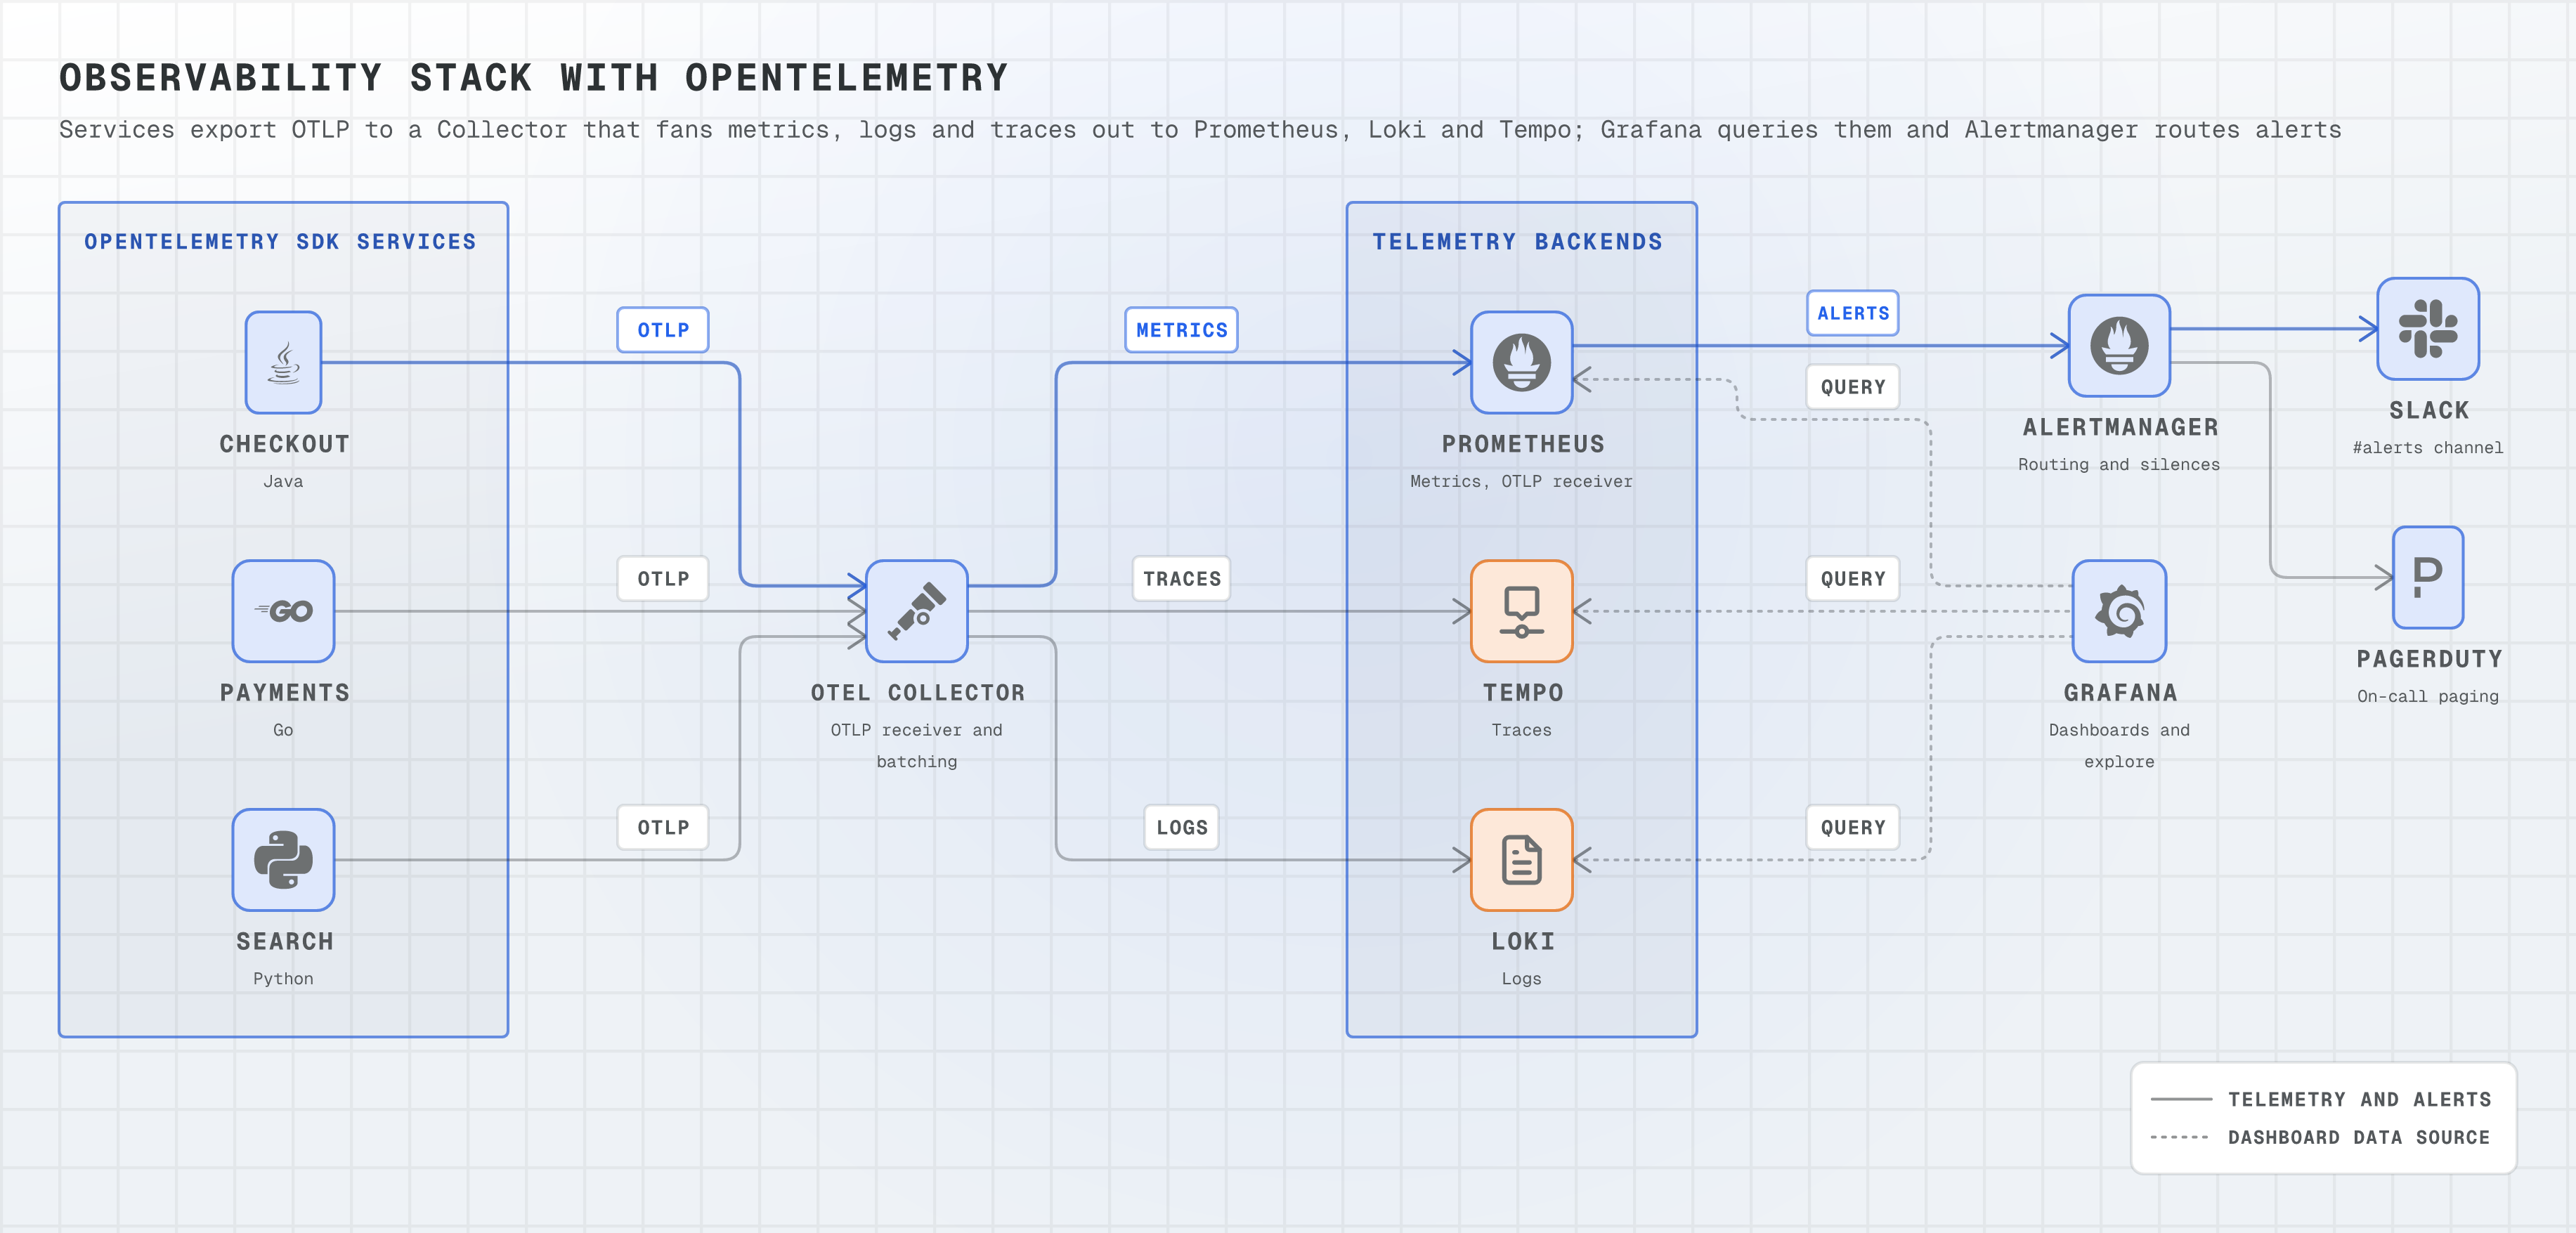
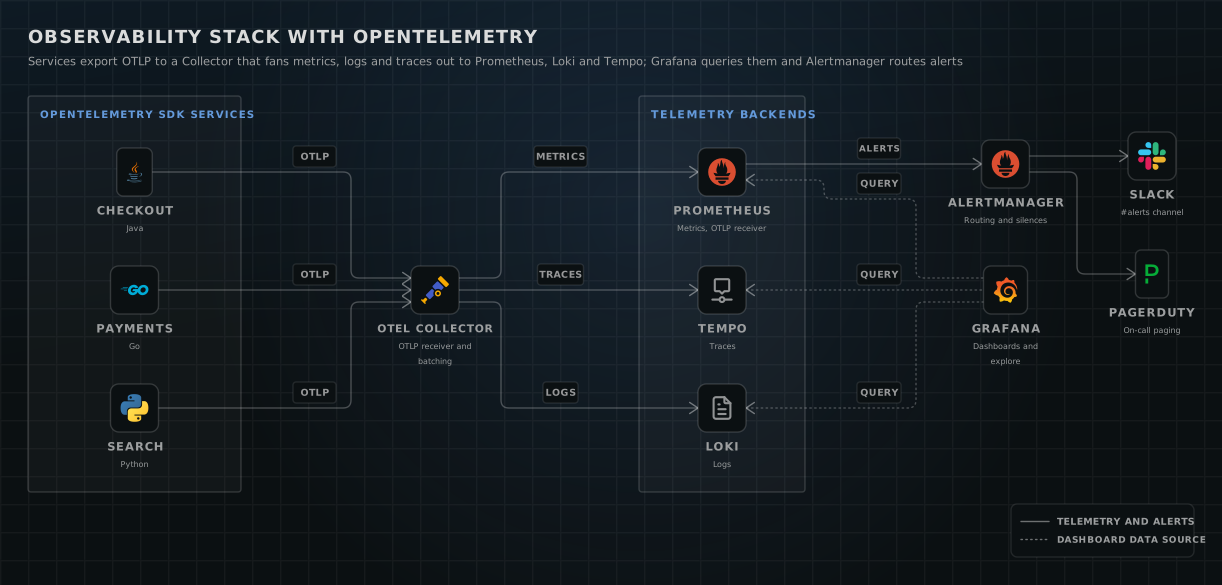
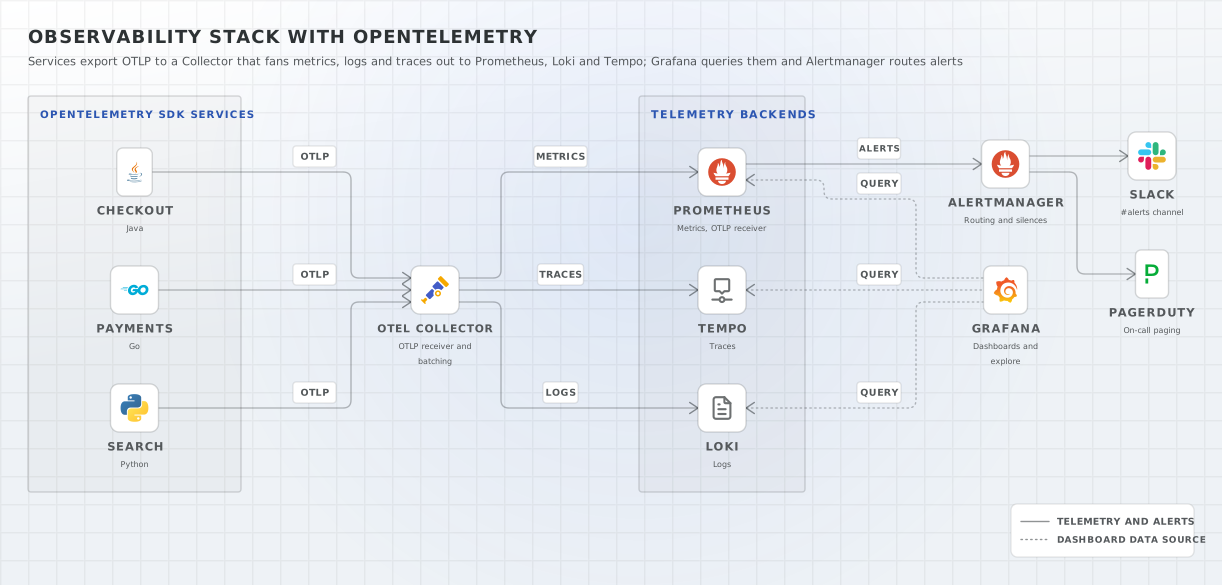
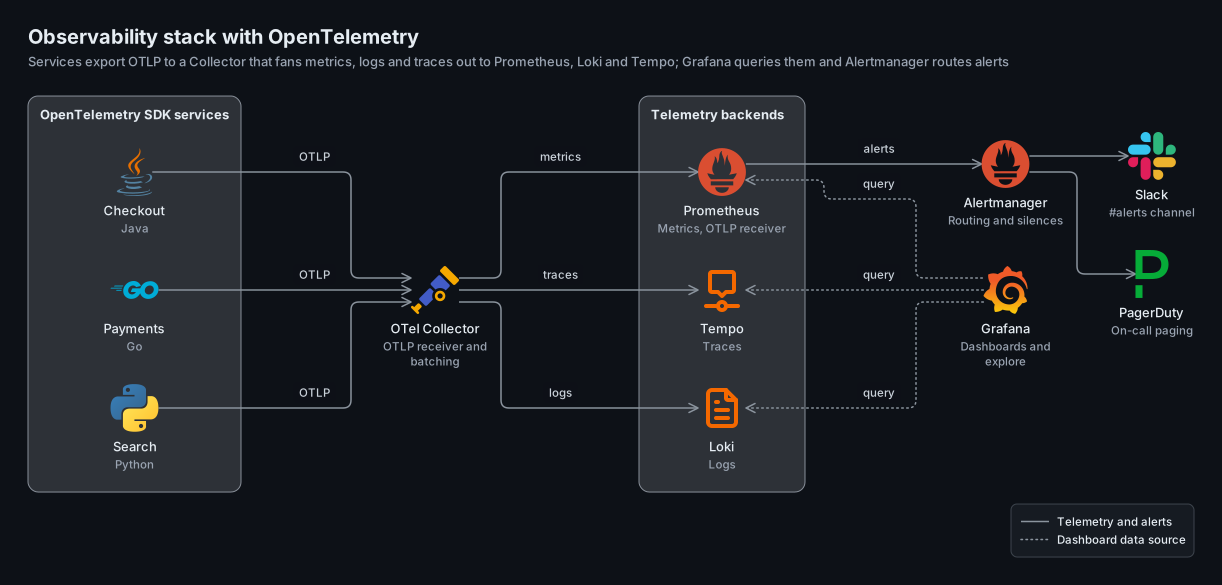
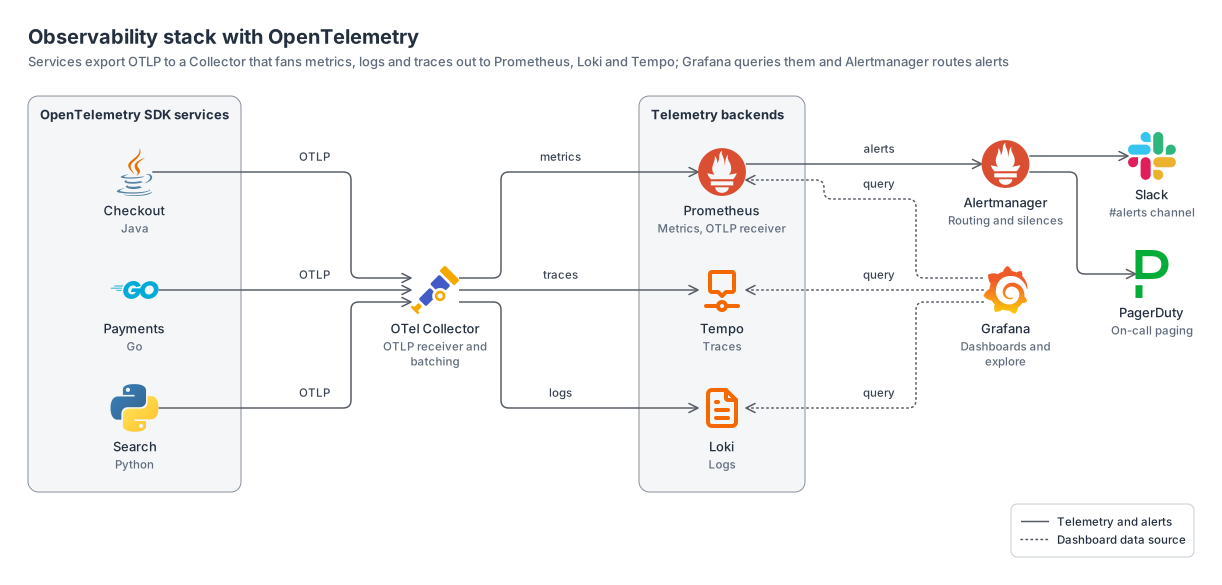
OpenTelemetry SDKs export to a Collector that fans out to Prometheus, Loki and Tempo, with Grafana querying them and Alertmanager routing to Slack and paging PagerDuty.
logos11 nodes2 groups7 edges
observability-stack.yamlOn GitHub
# yaml-language-server: $schema=../references/diagram.schema.json
title: Observability stack with OpenTelemetry
subtitle: Services export OTLP to a Collector that fans metrics, logs and traces out to Prometheus, Loki and Tempo; Grafana queries them and Alertmanager routes alerts
direction: right
# One port per edge: the dotted query arrows end on the backends and the solid alert edge leaves Prometheus.
layout: { merge: false, spacing: compact }

legend:
  solid: Telemetry and alerts
  dotted: Dashboard data source

groups:
  services: { type: zone, label: OpenTelemetry SDK services }
  backends: { type: zone, label: Telemetry backends }

nodes:
  checkout: { icon: logos:java, label: Checkout, note: Java, in: services }
  payments: { icon: logos:go, label: Payments, note: Go, in: services }
  search: { icon: logos:python, label: Search, note: Python, in: services }
  collector: { icon: logos:opentelemetry-icon, label: OTel Collector, note: OTLP receiver and batching }
  prometheus: { icon: logos:prometheus, label: Prometheus, note: "Metrics, OTLP receiver", in: backends }
  # No official Loki or Tempo mark in the packs: generic glyphs in Grafana orange.
  loki: { icon: generic:logs, color: "#f46800", label: Loki, note: Logs, in: backends }
  tempo: { icon: generic:stream, color: "#f46800", label: Tempo, note: Traces, in: backends }
  grafana: { icon: logos:grafana, label: Grafana, note: Dashboards and explore }
  alertmanager: { icon: logos:prometheus, label: Alertmanager, note: Routing and silences }
  slack: { icon: logos:slack-icon, label: Slack, note: "#alerts channel" }
  pagerduty: { icon: logos:pagerduty-icon, label: PagerDuty, note: On-call paging }

edges:
  - checkout, payments, search -> collector: OTLP
  - collector -> prometheus: metrics
  - collector -> loki: logs
  - collector -> tempo: traces
  # Grafana queries its data sources; written in layout order with the arrowheads at the start so they stay on the backends.
  - { from: [prometheus, loki, tempo], to: grafana, arrow: start, line: dotted, label: query }
  - prometheus -> alertmanager: alerts
  - alertmanager -> slack, pagerduty
Start from this one
Copies the spec to diagram.yaml, then renders every format.
$ orrery init observability-stack$ orrery render diagram.yaml -f all --theme both